
After years of investing in stocks, I’ve noticed that stock market participants place a lot of emphasis on how recessions and changes in interest rates affect stocks. This topic is even more important right now for investors in US stocks, given fears that a recession could happen soon in the country, and the interest rate cut last month by the Federal Reserve, the country’s central bank. I have no crystal ball, so I have no idea how the US stock market would react if a recession were to arrive in the near future and/or the Federal Reserve continues to lower interest rates.
What I have is historical context. History is of course not a perfect indicator of the future, but it can give us context for possible future outcomes. I’ve written a few articles over the years in this blog discussing the historical relationships between stocks, recessions, and movements in interest rates, some of which are given below (from oldest to the most recent):
- Points 16, 22, and 23 in 24 Facts About The Wild World Of Finance and Investing
- The Thing About The Coronavirus, Market Meltdowns, And Recessions…
- The Truths About Investing In Stocks During Recessions
- Recession and Stocks
- Risk-Free Rates and Stocks
- Stocks and Interest Rate Cuts
I thought it would be useful to collect the information from these separate pieces into a single place, so here goes!
The history of recessions and stocks
These are the important historical relationships between recessions and stocks:
- It’s not a given that stocks will definitely fall during a recession. According to a June 2022 article by Ben Carlson, Director of Institutional Asset Management at Ritholtz Wealth Management, there have been 12 recessions in the USA since World War II (WWII). The average return for the S&P 500 (a broad US stock market benchmark) when all these recessions took place was 1.4%. There were some horrible returns within the average. For example, the recession that stretched from December 2007 to June 2009 saw the S&P 500 fall by 35.5%. But there were also decent returns. For the recession between July 1981 and November 1982, the S&P 500 gained 14.7%.
- Holding onto stocks in the lead up to, through, and in the years after a recession, has mostly produced good returns. Carlson also showed in his aforementioned article that if you had invested in the S&P 500 six months prior to all of the 12 recessions since WWII and held on for 10 years after each of them, you would have earned a positive return on every occasion. Furthermore, the returns were largely rewarding. The worst return was a total gain of 9.4% for the recession that lasted from March 2001 to November 2001. The best was the first post-WWII recession that happened from November 1948 to October 1949, a staggering return of 555.7%. After taking away the best and worst returns, the average was 257.2%.
- Avoiding recessions flawlessly would have caused your return to drop significantly. Data from Michael Batnick, Carlson’s colleague at Ritholtz Wealth Management, showed that a dollar invested in US stocks at the start of 1980 would be worth north of $78 around the end of 2018 if you had simply held the stocks and did nothing. But if you invested the same dollar in US stocks at the start of 1980 and expertly side-stepped the ensuing recessions to perfection, you would have less than $32 at the same endpoint.
- Stocks tend to bottom before the economy does. The three most recent recessions in the USA prior to COVID-19 would be the recessions that lasted from July 1990 to March 1991, from March 2001 to November 2001, and from December 2007 to June 2009. During the first recession in this sample, data on the S&P 500 from Yale economist Robert Shiller, who won a Nobel Prize in 2013, showed that the S&P 500 bottomed in October 1990. In the second episode, the S&P 500 found its low 15 months after the end of the recession, in February 2003. This phenomenon was caused by the aftermath of the dotcom bubble’s bursting. For the third recession, the S&P 500 reached a trough in March 2009, three months before the recession ended. Moreover, after the December 2007 – June 2009 recession ended, the US economy continued to worsen in at least one important way over the next few months. In March 2009, the unemployment rate was 8.7%. By June, it rose to 9.5% and crested at 10% in October. But by the time the unemployment rate peaked at 10%, the S&P 500 was 52% higher than its low in March 2009. Even if we are right today that the economy would be in worse shape in the months ahead, stocks may already have bottomed or be near one – only time can tell.
- The occurrence of multiple recessions has not stopped the upward march of stocks. The logarithmic chart below shows the performance of the S&P 500 (including dividends) from January 1871 to February 2020. It turns out that US stocks have done exceedingly well over these 149 years (up 46,459,412% in total including dividends, or 9.2% per year) despite the US economy having encountered numerous recessions. If you’re investing for the long run, recessions are nothing to fear.

The history of interest rates and stocks
These are the important historical relationships between interest rates and stocks:
- Rising interest rates have been met with rising valuations. According to Robert Shiller’s data, the US 10-year Treasury yield was 2.3% at the start of 1950. By September 1981, it had risen to 15.3%, the highest rate recorded in Shiller’s dataset. In that same period, the S&P 500’s price-to-earnings (P/E) ratio moved from 7 to 8. In other words, the P/E ratio for the S&P 500 increased slightly despite the huge jump in interest rates. It’s worth noting too that the S&P 500’s P/E ratio of 7 at the start of 1950 was not a result of earnings that were temporarily inflated. Yes, there’s cherry picking with the dates. For example, if I had chosen January 1946 as the starting point, when the US 10-year Treasury yield was 2.2% and the P/E ratio for the S&P 500 was 19, then it would be a case of valuations falling alongside rising interest rates. But this goes to show that while interest rates have a role to play in the movement of stocks, it is far from the only thing that matters.
- Stocks have climbed in rising interest rate environments. In a September 2022 piece, Carlson showed that the S&P 500 climbed by 21% annually from 1954 to 1964 even when the yield on 3-month Treasury bills (a good proxy for the Fed Funds rate, which is the key interest rate set by the Federal Reserve) surged from around 1.2% to 4.4% in the same period. In the 1960s, the yield on the 3-month Treasury bill doubled from just over 4% to 8%, but US stocks still rose by 7.7% per year. And then in the 1970s, rates climbed from 8% to 12% and the S&P 500 still produced an annual return of nearly 6%.
- Stocks have done poorly in both high and low interest rate environments, and have also done well in both high and low interest rate environments. Carlson published an article in February 2023 that looked at how the US stock market performed in different interest rate regimes. It turns out there’s no clear link between the two. In the 1950s, the 3-month Treasury bill (which is effectively a risk-free investment, since it’s a US government bond with one of the shortest maturities around) had a low average yield of 2.0%; US stocks returned 19.5% annually back then, a phenomenal gain. In the 2000s, US stocks fell by 1.0% per year when the average yield on the 3-month Treasury bill was 2.7%. Meanwhile, a blockbuster 17.3% annualised return in US stocks in the 1980s was accompanied by a high average yield of 8.8% for the 3-month Treasury bill. In the 1970s, the 3-month Treasury bill yielded a high average of 6.3% while US stocks returned just 5.9% per year.
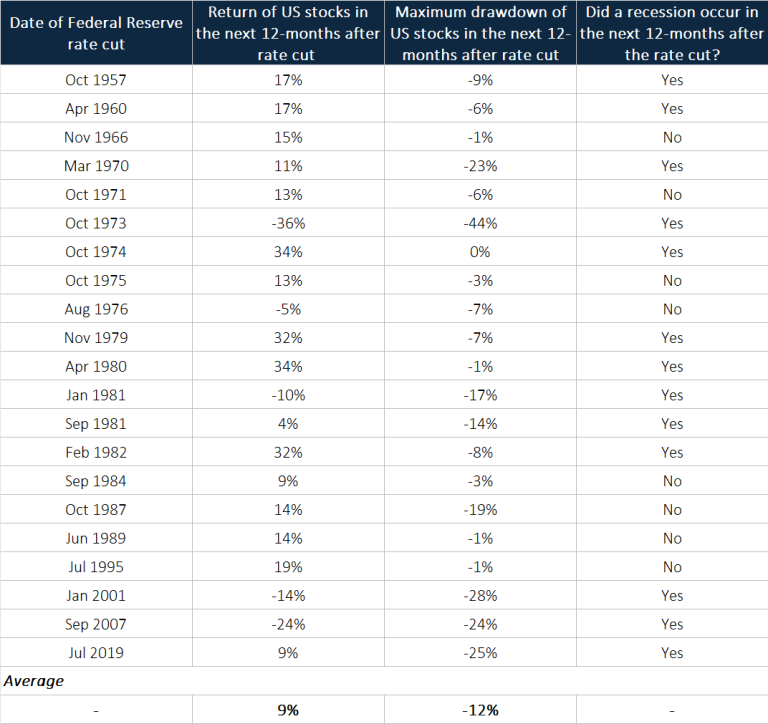
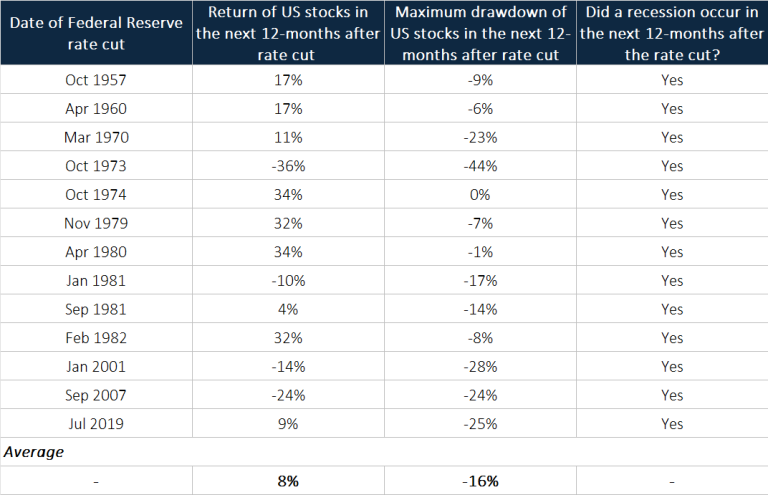
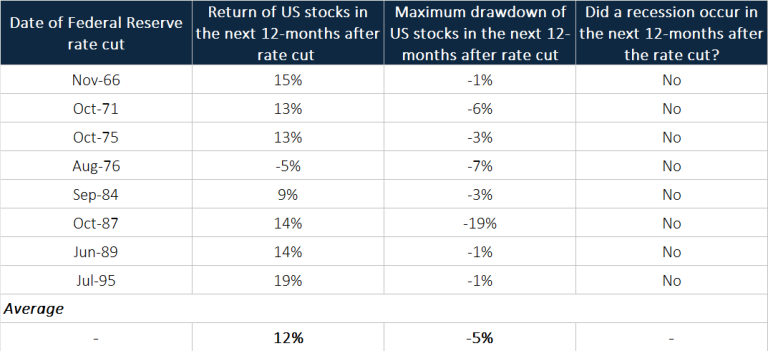
- A cut in interest rates by the Federal Reserve is not guaranteed to be a good or bad event for stocks. Josh Brown, CEO of Ritholtz Wealth Management, shared fantastic data in an August 2024 article on how US stocks have performed in the past when the Federal Reserve lowered interest rates. His data, in the form of a chart, goes back to 1957 and I reproduced them in tabular format in Table 1; it shows how US stocks did in the next 12 months following a rate cut, as well as whether a recession occurred in the same window. I also split the data in Table 1 according to whether a recession had occurred shortly after a rate cut, since eight of the 21 past rate-cut cycles from the Federal Reserve since 1957 took place without an impending recession. Table 2 shows the same data as Table 1 but for rate cuts with a recession; Table 3 is for rate cuts without a recession. What the data show is that US stocks have historically done well, on average, in the 12 months following a rate-cut. The overall record, seen in Table 1, is an average 12-month forward return of 9%. When a recession happened shortly after a rate-cut, the average 12-month forward return is 8%; when a recession did not happen shortly after a rate-cut, the average 12-month forward return is 12%. A recession is not necessarily bad for stocks. As Table 2 shows, US stocks have historically delivered an average return of 8% over the next 12 months after rate cuts that came with impending recessions. It’s not a guarantee that stocks will produce good returns in the 12 months after a rate cut even if a recession does not occur, as can be seen from the August 1976 episode in Table 3.
Conclusion
Knowing how stocks have performed in the past in the context of recessions and changes in interest rates provides us with possible paths that stocks could take in the future. But it’s also worth bearing in mind that anything can happen in the financial markets. Things that have never happened before do happen, so there are limits to learning from history. Nonetheless, there’s a really important lesson from all the data seen above that I think is broadly applicable even far into the future, and it is that one-factor analysis in finance – “if A happens, then B will occur” – should be largely avoided because clear-cut relationships are rarely seen.
Disclaimer: The Good Investors is the personal investing blog of two simple guys who are passionate about educating Singaporeans about stock market investing. By using this Site, you specifically agree that none of the information provided constitutes financial, investment, or other professional advice. It is only intended to provide education. Speak with a professional before making important decisions about your money, your professional life, or even your personal life. I currently have no vested interest in any company mentioned. Holdings are subject to change at any time.